Tuesday, March 10, 2020

GBPJPY - bullish formation

I am becoming more and more bullish for GBPJPY. On daily chart, it looks like:
(1) ABC correction has finished, and it may be forming wave 3
(2) I can see a large head and shoulder pattern - this is really big head and shoulder

I like this confluence. The only concern is that there is still risk of coronavirus shock, and yen could strengthen if the stock market volatility rises... So far the price is moving as expected. Let's see how it goes.

[GBPJPY - daily chart]

Monday, March 9, 2020

Is this an opportunity to buy oil?


It is rare to see oil price drop below $30. I would consider this a good opportunity to buy oil for long-term investment both from (1) technical, and (2) fundamental reasons.

(1) technical reason
Looking at the weekly chart, the price is potentially forming a triangle. Ideally, the price should drop below $25 and bounce back.


(2) fundamental reason
The oil price drop was caused by Saudi Arabia for a political reason. With the current price level, the majority of oil fields around the world are not profitable, therefore there will be significant decrease in production in due course. Once coronavirus issue is calm down, oil price should bounce back due to demand / supply imbalance.

Saturday, March 7, 2020

Bitcoin - potentially forming wave 3 upswing

After the price retraced, it looks like Bitcoin has finished ABC correction as wave 2. The end of wave 2 is exactly at 50% retracement level of wave 1. This is typical for wave 2.

If this analysis is correct, the next upswing is wave 3 and it should break past the previous high!


[Bitcoin - Daily chart]

GBPJPY update - downside potential


In the previous post, I mentioned GBPJPY could reverse up. After that, I closed my long position with small profit when I saw the upswing was weak. I am becoming more bearish on stock market overall, thus yen pairs could strengthen further in general.

It is possible that GBPJPY is still in the midst of wave C, and it could go down further as wave 5 of wave C. This view could be further strengthened if the S&P500 futures goes down in the beginning of the week (see my other post on S&P500 ).


[GBPJPY 15min chart]

S&P500 - potential for 1 more leg down


Until 1 month ago, most of Elliott Wave analysis I saw suggested S&P500 was still on bullish trend.
However, with breach of key levels which I thought could work as support and the sharpness of the downward move, my view has to be changed.

Here is my current view as of today.

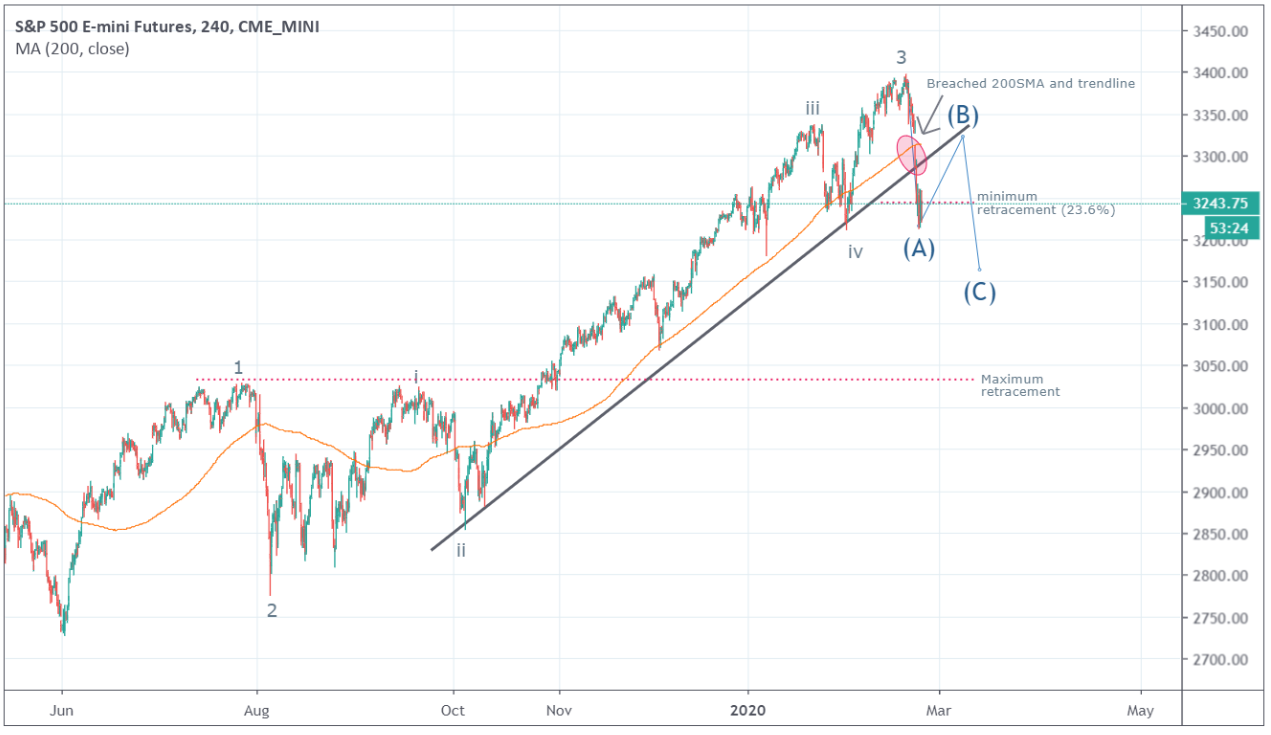
(1) The bullish trend since Dec 2018 has ended.

With the current downside move, the price clearly breached the top of wave 1 ($2960).
In Elliot wave theory, there is a possibility that this could be still a bullish diagonal formation, but now I think the possibility of that is low because of the wave characteristics:
  - the sharpness of the downside move
  - even after the sudden Fed rate cut, the upswing was very weak, and pulled back fast. Also this upswing looks like a ABC formation, which is bearish (see hourly chart below).


[Daily chart]

[Hourly chart]


(2) Now the price is forming wave C - another leg down

The sharp downside move to around $2850 level was a bit surprise. I was expecting a sharp pull back, but this did not happen even after Fed rate cut. Like said before, this upswing looks like a ABC formation, and Wave B could have ended already. If this is the case, the current down move is forming wave C.

How far could it go down?
Nobody knows, but assuming this is zig zag down and wave C travels the same distance as wave A, it could go down to $2600 level. If it travels x1.618, it could reach $2260.

With current volatility, anything could happen, but this is my current base scenario. Is this a buying opportunity? Clearly NO, to me. At least not yet.

(3) Currently forming wave 1 of wave C

Going down to 15min chart, it looks like the price formed a irregular flat as wave 4 (of wave 1 of wave C, sorry that this is complicated) and the market closed on Friday. If this is correct, there could be further downside in the beginning of the week.

Once the wave 1 of wave C has completed, then price could bounce back on the short-term as wave 2 of wave C.

[15 min chart]


To me, Elliot wave is a scenario planning tool. The price may not behave as you expect, but you can be prepared for what may happen. We have to keep updating our views as the price behavior unfolds. Let's have a good ride!


Tuesday, March 3, 2020

Gold uptrend may have ended and starts to retrace down

I posted an analysis on Gold on my blog a while ago, saying the uptrend may be ending.
Now gold is likely to have finished 5 waves impulse, and starting to retrace down. Probably this will be ABC correction, but could be time consuming. Let's watch how the price behave.

[Gold daily chart]

Monday, March 2, 2020

GBPJPY - potential reversal

A time-consuming ABC correction may have finished for GBPJPY . If this understanding of market structure is correct, the next swing up should be strong and big. I consider this very good risk-reward trade. I already entered a long trade!


[GBPJPY 4 hour chart]

Tuesday, February 25, 2020

S&P500 went down as expected - further downside potential

I posted an article "S&P500 may go down on the short-term", and S&P has been shot down as expected. The media article is saying it is because of "coronavirus" panic, but this crash was well expected from Elliott Wave point of view.

If you look at the overall structure, wave 3 appears to have ended and the S&P500 dropped sharply. There could be a bit more downside. The price reached minimum target (23.6% retracement) and 5 sub-waves in wave A appears to be ending. I am expecting a retrace back to potentially near the broken trend line , and there could be another short opportunity if you see clear ABC pattern. I remain bearish on S&P500 for now until wave 4 completes clearly.

[4 hour chart ES]

Monday, February 24, 2020

GBPJPY - short-term buy

GBPJPY is likely to have completed wave 4. Under Elliott wave principle, wave 4 should not overlap with wave 1. ABC correction as wave 4 probably ended with the top of wave 1 and 200 SMA (1 hour chart) providing support. This is short-term buy. I will close as soon as wave 5 seems completed or the price does not react as I expect.


[GBPJPY 1 hour chart]


Sunday, February 23, 2020

BTCUSD - further upside potential


BTCUSD is potentially still in the midst of Wave 3. The price was clearly supported by 200 SMA in 4 hour chart. Wave iii of Wave 3 is short, therefore there could be a chance that wave v is extended. If the Wave v of Wave 3 is extended, it could reach around $12,000 - 13,000 range. I consider this good risk/reward trade (I already entered around $9700). Let's watch how the price behaves.

[BTCUSD 4 hours chart]

Also posted on tradingview.
https://www.tradingview.com/chart/BTCUSD/kvZKrrQX-BTCUSD-further-upside-potential/

Friday, February 21, 2020

ATOMBTC is going up as expected

I wrote an article saying ATOMBTC was likely to be forming wave 3.

The price has already increased by more than 10% for 2 days.

[ATOMBTC Daily chart]


If this is wave 3, the price would increase at least from current 0.0005 BTC to 0.0009 BTC, meaning more than 80% return potential.

Wednesday, February 19, 2020

Gold price has reached $1600 again - wave 5 may be ending

Gold price has reached $1,600 again.
Gold price uptrend since Aug 2018 has been following Elliott waves clearly.

It is more than likely that wave 5 is ending. And once it ends, the gold price is likely to retrace significantly.

The following is gold daily chart. You can see the momentum is weakening.


I cannot conclude wave 5 has finished at this point. There may be a bit more upside before retracing back. Watch for the price action.


ATOMBTC may be forming Wave 3!!


ATOMBTC is another cryptocurrency I have been watching. Looking at the wave structure, there is  high chance that ABC correction has finished and wave 3 is forming.

The following is 4 hour chart.


If this is wave 3, the up swing should be strong and should break past the recent high.
If you enter the trade well, the risk reward ratio could be extremely good.

EURGBP is ready to go up (finally)?

Well, I have been watching EURGBP for a while.
I have seen a few Elliott wave traders calling a long entry for the past few weeks, but Euro has kept weakening.
I also entered a long trade, but took some small profits only.

ABC correction might have finished at last. After the first impulse waves which started around mid December 2019 finished around mid January 2020, EURGBP has been experiencing time-consuming retracement. If I look at the structure of waves in details, there is a good chance that this correction has ended or is ending.

If you look at 4 hours chart below, we can observe divergence on RSI as well, which indicates weakening downside momentum.


If this analysis is correct, the next up swing should be strong wave 3. You could expect strong wave breaking past the recent high (0.86). Let's see how the price behaves in coming days. If the price remains weak, there could be an alternative scenario.

Tuesday, February 18, 2020

S&P500 may go down on the short-term (18th Feb, 2020)

US market was quiet yesterday due to Presidents' Day, but S&P500 futures (ES) opened with gap down.

Elliot wave count on the daily chart suggests wave 5 may have finished or be finishing. RSI is showing divergence, which also confirms the weakness in the uptrend.


[S&P500 futures (ES) - Daily chart]


Let's look at the hourly chart to examine the details of wave 5. It looks like wave 5 of wave 5 formed ending diagonal. The price broke down the lower trend line already.


[S&P futures - hourly chart]


Overall, I think S&P500 is still on the bullish trend, however the uptrend is getting weakened on the short-term and the price may go down.