Tuesday, February 25, 2020

S&P500 went down as expected - further downside potential

I posted an article "S&P500 may go down on the short-term", and S&P has been shot down as expected. The media article is saying it is because of "coronavirus" panic, but this crash was well expected from Elliott Wave point of view.

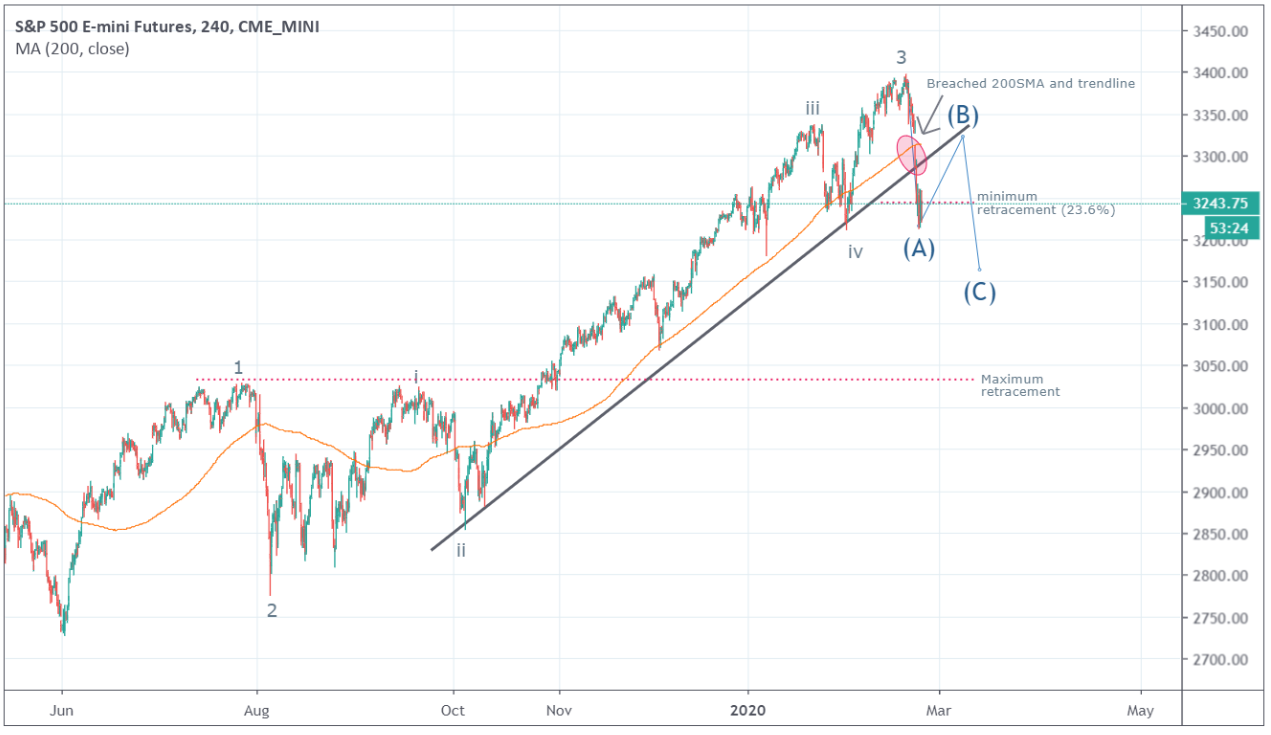
If you look at the overall structure, wave 3 appears to have ended and the S&P500 dropped sharply. There could be a bit more downside. The price reached minimum target (23.6% retracement) and 5 sub-waves in wave A appears to be ending. I am expecting a retrace back to potentially near the broken trend line , and there could be another short opportunity if you see clear ABC pattern. I remain bearish on S&P500 for now until wave 4 completes clearly.

[4 hour chart ES]

Monday, February 24, 2020

GBPJPY - short-term buy

GBPJPY is likely to have completed wave 4. Under Elliott wave principle, wave 4 should not overlap with wave 1. ABC correction as wave 4 probably ended with the top of wave 1 and 200 SMA (1 hour chart) providing support. This is short-term buy. I will close as soon as wave 5 seems completed or the price does not react as I expect.


[GBPJPY 1 hour chart]


Sunday, February 23, 2020

BTCUSD - further upside potential


BTCUSD is potentially still in the midst of Wave 3. The price was clearly supported by 200 SMA in 4 hour chart. Wave iii of Wave 3 is short, therefore there could be a chance that wave v is extended. If the Wave v of Wave 3 is extended, it could reach around $12,000 - 13,000 range. I consider this good risk/reward trade (I already entered around $9700). Let's watch how the price behaves.

[BTCUSD 4 hours chart]

Also posted on tradingview.
https://www.tradingview.com/chart/BTCUSD/kvZKrrQX-BTCUSD-further-upside-potential/

Friday, February 21, 2020

ATOMBTC is going up as expected

I wrote an article saying ATOMBTC was likely to be forming wave 3.

The price has already increased by more than 10% for 2 days.

[ATOMBTC Daily chart]


If this is wave 3, the price would increase at least from current 0.0005 BTC to 0.0009 BTC, meaning more than 80% return potential.

Wednesday, February 19, 2020

Gold price has reached $1600 again - wave 5 may be ending

Gold price has reached $1,600 again.
Gold price uptrend since Aug 2018 has been following Elliott waves clearly.

It is more than likely that wave 5 is ending. And once it ends, the gold price is likely to retrace significantly.

The following is gold daily chart. You can see the momentum is weakening.


I cannot conclude wave 5 has finished at this point. There may be a bit more upside before retracing back. Watch for the price action.


ATOMBTC may be forming Wave 3!!


ATOMBTC is another cryptocurrency I have been watching. Looking at the wave structure, there is  high chance that ABC correction has finished and wave 3 is forming.

The following is 4 hour chart.


If this is wave 3, the up swing should be strong and should break past the recent high.
If you enter the trade well, the risk reward ratio could be extremely good.

EURGBP is ready to go up (finally)?

Well, I have been watching EURGBP for a while.
I have seen a few Elliott wave traders calling a long entry for the past few weeks, but Euro has kept weakening.
I also entered a long trade, but took some small profits only.

ABC correction might have finished at last. After the first impulse waves which started around mid December 2019 finished around mid January 2020, EURGBP has been experiencing time-consuming retracement. If I look at the structure of waves in details, there is a good chance that this correction has ended or is ending.

If you look at 4 hours chart below, we can observe divergence on RSI as well, which indicates weakening downside momentum.


If this analysis is correct, the next up swing should be strong wave 3. You could expect strong wave breaking past the recent high (0.86). Let's see how the price behaves in coming days. If the price remains weak, there could be an alternative scenario.

Tuesday, February 18, 2020

S&P500 may go down on the short-term (18th Feb, 2020)

US market was quiet yesterday due to Presidents' Day, but S&P500 futures (ES) opened with gap down.

Elliot wave count on the daily chart suggests wave 5 may have finished or be finishing. RSI is showing divergence, which also confirms the weakness in the uptrend.


[S&P500 futures (ES) - Daily chart]


Let's look at the hourly chart to examine the details of wave 5. It looks like wave 5 of wave 5 formed ending diagonal. The price broke down the lower trend line already.


[S&P futures - hourly chart]


Overall, I think S&P500 is still on the bullish trend, however the uptrend is getting weakened on the short-term and the price may go down.